- Quantumics
- Feb 6, 2023
- 4 min read
Introduction

If you're like me, you've probably heard of self-service analytics but haven't really thought about why it's a good idea. Maybe you've heard that it's just a buzzword, or maybe you're not sure how to enable self-service BI or what its benefits are for your organization. I'm here to set the record straight: Self-service BI is here to stay and has real value for businesses—even small ones.
Easier to understand the data
Data becomes easier to understand when it's presented in a way that makes sense. You can quickly spot trends, patterns, and anomalies. This information is crucial in communicating with others, making decisions, and helping your organization reach its goals.
Helps personnel make more informed decisions.
Self-service analytics allows you to make better decisions because you can understand your data better.
● You'll be able to answer questions like, "Why did we receive a large number of complaints about customer service on Tuesday?", or "What are the most popular products?"
● You can also see how your data is related and how it changes over time. For example, if sales are declining at one store location but increasing in others, this could indicate that something might be wrong in that particular store.
Data is visualized, which makes it easier to understand.
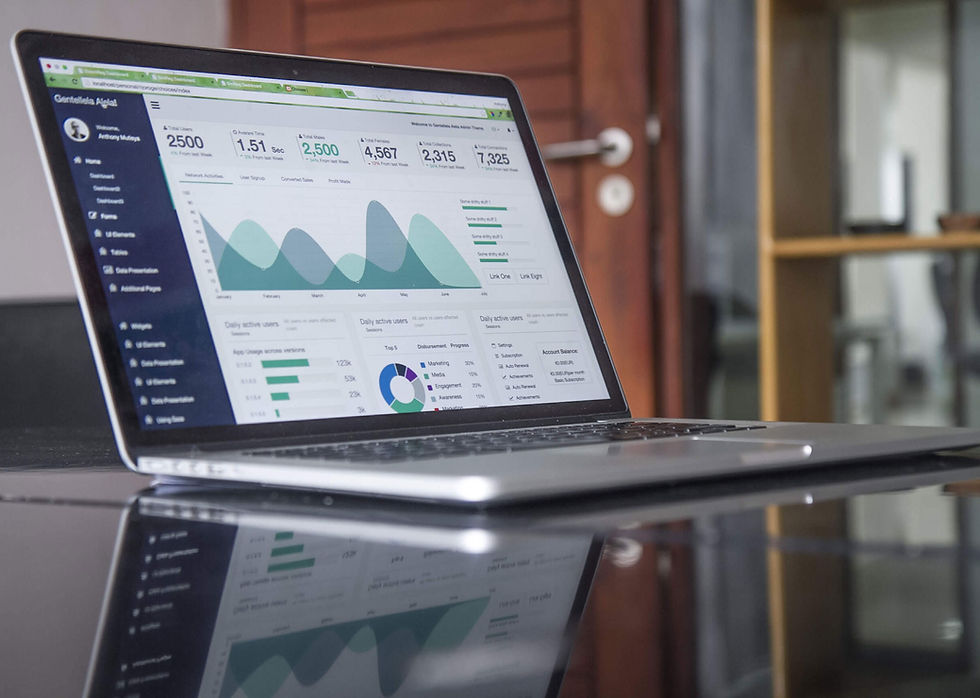
A key benefit of self-service analytics is that data is visualized. This makes it easier for you to understand, because you can see the trends and patterns in your data more clearly than if they were hidden behind rows and rows of numbers. Data visualization also allows you to better understand relationships between different sets of data, as well as how changes impact your company’s performance over time.
Self-service analytics help you learn more about your customers.
Self-service analytics can help you learn more about your customers.
● Categorize data by customer segment. You can use self-service analytics to categorize your data into segments based on various factors, including age, gender and location. For example, if you’re a retailer that sells products to both men and women, you can use self-service analytics to classify all the customers who purchased one item from you in the past month as “male” or “female.” Then, analyze the differences between male and female shoppers: Do they spend an equal amount of money with you? Do they buy similar items? Are there any other factors that make them different?
● Analyze customer segmentation data. After creating groups of customers based on certain criteria (such as age), analyze how their behaviour differs within those groups—do some groups spend more than others do? How do their buying habits differ from each other? This information will help improve future campaigns aimed at specific demographic segments that have been identified through self-service analytics
If you are a small business, self-service BI saves money.
If you are a small business, self-service BI can save money.
Data analysts are expensive—and they can be hard to find. Companies without hundreds of employees may not have the budget for an in-house data analyst to dedicate time to creating reports and dashboards for the business. Instead of hiring an analyst or paying for outsourcing services, consider self-service BI software packages that allow non-technical users (such as business analysts) to create reports and dashboards on their own.
You have more flexibility with your budget: You don’t have to make a huge upfront investment or pay ongoing licensing fees for expensive software licenses if you don’t need them. Self-service BI is often cheaper than hiring an outside firm, especially if you only need one report at a time or want some basic analysis done once in a while.
Since there is no initial cost associated with setting up your system (aside from consulting fees), it's possible that using self-service analytics could actually save money over having an internal team do this work!
It's easier for everyday people to work with data when it is visualized properly.
Self-service analytics tools is an important part of the future of data science, as it makes data more accessible to everyday people. By putting the tools in the hands of those who need them most and allowing them to visualize their own data, companies are able to get more out of their existing resources and save money. This can be especially helpful for small businesses or non-profits with limited resources that would otherwise struggle with traditional analytics software.
It's also easier for everyday people to work with data when it's visualized properly, as this means they don't have to spend as much time trying out different queries in order to learn what
they need from their data sets. A lot of people struggle with using spreadsheets or other forms of tabular presentation because they don't understand how each column relates back up top: if someone wants answers about a specific product category (for example), but only has access at one level down—like within a single brand—then they won't necessarily be able to see how everything connects together without some extra effort on their part (and no one wants that).
Conclusion
Self-service analytics is a great way for any company to take advantage of the power of their data. It allows you to make better decisions, track your customers and improve your business.
